Data Streaming Platform Using Kafka, Kubernetes, MongoDB, InfluxDB and Grafana. Part 1
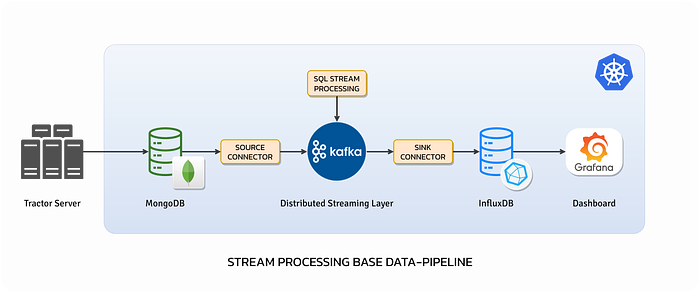
I am building a data streaming platform for a visual effects production company. This article will follow my current architecture for the platform.
Goal : Visualize the render jobs being spooled on our render farm to analyze which shows are taking up the most resources and allocate them appropriately.

This architecture can be divided into 4 key parts,
- Capture raw sensor data stream.
- Source and Process the data stream in Apache Kafka.
- Store the stream in a timeseries database.
- Visualize the stored stream in a dashboard.
All our application containers will be deployed and orchestrated using Kubernetes for scalability and fault tolerance. The entire pipeline is built using microservices and open source software.
My kubernetes cluster has 3 worker nodes and 1 tainted Master node as follows,

1. Capture raw sensor data stream
To store the raw sensor data from the render farm server, I used MongoDB which is an open-source NoSQL database. One of the key reasons to choose MongoDB was its ability to store raw JSON like documents without any schema definition requirements.
To install MongoDB I used the official bitnami helm chart : https://github.com/bitnami/charts/tree/master/bitnami/mongodb
If you are deploying the applications in on-prem environments, you will need to host your own image registry and edit the repository location for the images in the chart.
Use LoadBalancer or NodePort service type to make the database accessible from outside the kubernetes cluster. By default the chart is deployed with the LoadBalancer service type.
If you need more information about services, visit this link.

My services look like this,

The basic example script to send JSON formatted payload messages to MongoDB using pymongo client is as follows,

This will create a DB named test, with a collection named data which will hold the sent JSON message payload.
2. Source and Process the data stream in Apache Kafka.
With the messages being stored in the DB collection, now we need to procure those messages and send them to Kafka which is our chosen distributed streaming platform. Kafka is an open-source, distributed event streaming platform. One of the key utility of Kafka is its high fault tolerance and the ability to scale horizontally.
Internal workings of Kafka are well documented. In this article we are only focusing on Kafka-Connect and KSQL Server.
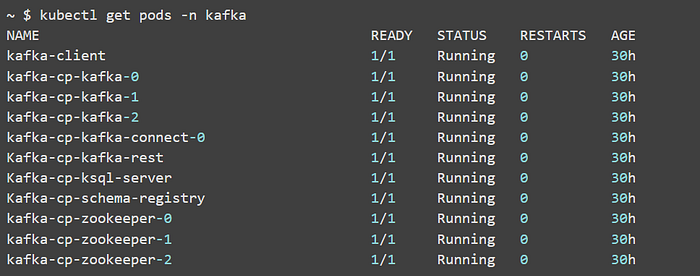
To deploy Kafka on kubernetes I used the official confluent platform helm chart.

To source the messages being stored in the MongoDB instances into Kafka, we are using Kafka-Connect which can connect with a variety of different databases and file types to either source or sink the stream data.
For this base-pipeline we are using the open source MongoDB Source Connectors.
The service environment for Kafka is as follows,

To submit a Kafka-Connect job, we will use the cluster IP of the Kafka-Connect to PUT a JSON config file to create a source job.
Robin Moffatt writes the best material on Kafka and its internal workings. This article is very thorough and will give you insight into converters and schemas.
My configuration looks like this,

Once the configuration file goes through, check the topic list. There will be a new mongo source topic if everything made connection correctly.
If you face any issues in this part, what helps is reading the Kafka-Connect logs which will pinpoint the exact problem. Read the documentation for more configurations that are available for this connector and which can help your particular project.
You can use kafka-console-consumer binary which comes with the downloads package to print and see the messages as they are populated.

My console results look like this,

The messages are in raw format and would need some massaging before they can sink in Influx to build a real-time visualization dashboard in Grafana.
In Part-2 we will further delve into the KSQL processing and sinking the messages into InfluxDB using free to use lenses.io connectors.
Have a good one out there and take care!
